Marine Biodiversity Science Center

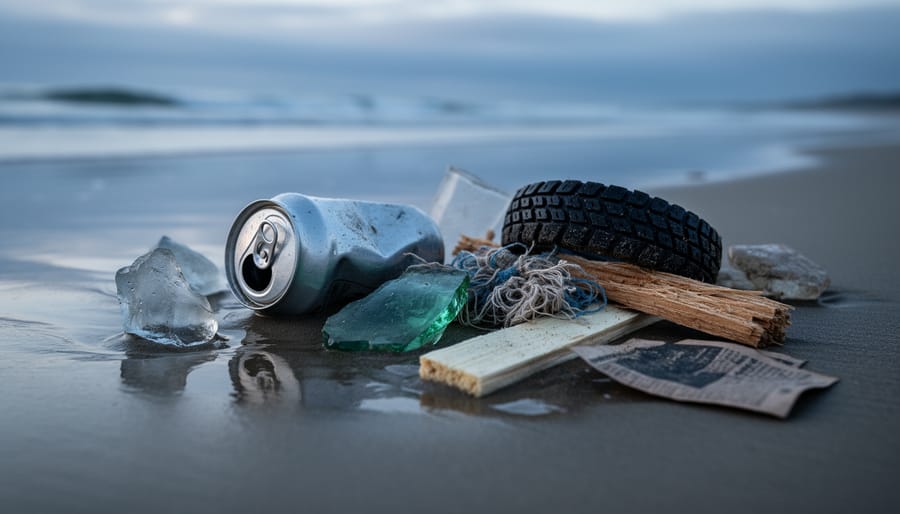
Marine debris is best described as being composed of seven primary materials: plastics, metals, glass, rubber, textiles, processed lumber, and paper or cardboard. These categories form the foundation of nearly every cleanup effort and data collection initiative worldwide, representing the persistent waste that travels from land-based sources and maritime activities into our oceans, where it threatens marine life, disrupts ecosystems, and even enters our food chain.
Understanding this composition isn’t just an academic exercise. When volunteers and researchers catalog debris along coastlines and in open water, they’re tracking which materials dominate our pollution footprint and where intervention will have the greatest impact. Plastics consistently account for 60 to 80 percent of all marine debris recorded globally, but the story doesn’t end there. Each material type presents distinct challenges for wildlife, from entanglement in derelict fishing gear to ingestion of microplastics by filter feeders.
The breakdown matters because cleanup strategies, policy solutions, and prevention efforts must target the right sources. A cigarette butt (cellulose acetate plastic), an aluminum can, a rubber tire fragment, and a glass bottle each require different approaches to mitigation. By identifying what clutters our coastlines and open waters, scientists can trace pollution back to its origins and develop smarter interventions.
This article walks you through each of the seven material categories, explaining what falls into each group, how it reaches the ocean, and why it persists. You’ll also discover how your participation in debris mapping contributes to a global dataset that informs conservation policy and drives real-world change.
How We Categorized Marine Debris Components
We organized the seven debris categories in this roundup using four evidence-based criteria that marine scientists and cleanup coordinators rely on when assessing ocean pollution. These standards ensure our breakdown reflects what volunteers and researchers actually encounter during beach cleanups and offshore surveys, while helping readers understand why certain materials demand urgent attention.
Prevalence in Ocean Surveys
The first criterion examines how frequently each material type appears in documented marine debris inventories. We drew on international coastal cleanup data collected annually by Ocean Conservancy, which aggregates findings from millions of volunteer hours across 100+ countries. NOAA’s Marine Debris Monitoring and Assessment Project (MDMAP) protocols, used in systematic shoreline surveys, provided additional frequency benchmarks. Materials that consistently rank in the top contributors by item count or weight earned priority in our categorization.
Persistence in Marine Environments
We evaluated how long each material type endures in saltwater conditions. Plastics and metals persist for decades to centuries, while certain treated papers and processed wood products break down far slower than their natural counterparts. This persistence factor determines whether debris becomes a long-term ecosystem threat or a temporary presence, directly influencing NOAA cleanup strategy development and resource deployment decisions.
Impact on Marine Life
Each category’s documented harm to ocean species shaped our selection. We prioritized materials with proven ingestion, entanglement, or toxicity records from peer-reviewed marine biology research. Fishing gear, balloons, and microplastics, for example, appear repeatedly in necropsy reports and stranding data, making them critical categories despite varying abundance levels.
Relevance to Current Mapping Operations
Finally, we included materials that mapping technologies can reliably detect and that cleanup teams regularly target, ensuring this guide serves practical field applications.
1. Plastic Materials: The Dominant Force
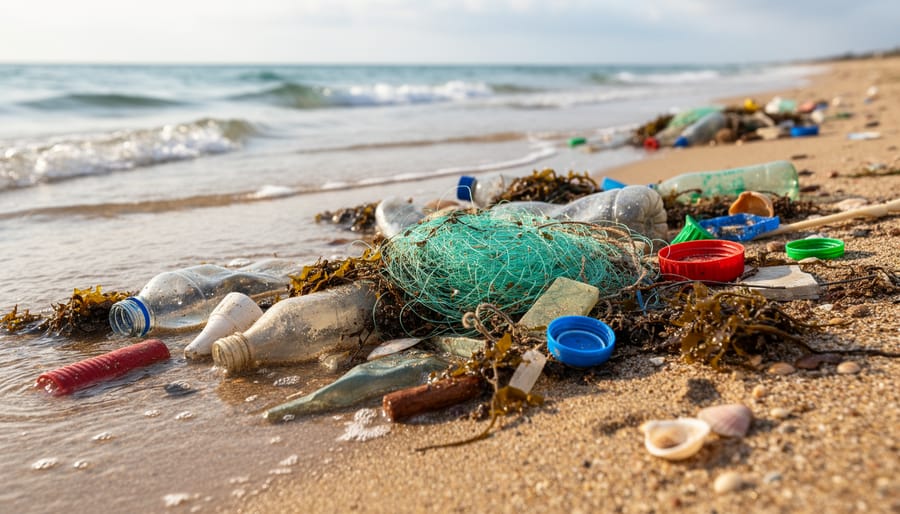
Plastics dominate every ocean survey and coastal cleanup operation worldwide, consistently accounting for 60 to 80 percent of all marine debris collected. This overwhelming presence isn’t a single problem but a constellation of petroleum-based polymers, each with distinct characteristics that complicate removal efforts and persist for decades or centuries in marine environments.
The most frequently encountered plastic debris items, based on global cleanup data, include:
- Cigarette filters (cellulose acetate plastic fibers that never fully biodegrade)
- Food wrappers and single-use packaging (polyethylene and polypropylene films)
- Beverage bottles (PET plastic that fragments into sharp shards)
- Bottle caps and lids (high-density polyethylene that floats and travels far)
- Fishing nets and gear (nylon and polypropylene that entangle marine life for years)
What makes plastic debris so persistent? Unlike organic materials that decompose through biological processes, plastics only break down through mechanical fragmentation and UV degradation, processes that take 20 to 500 years depending on polymer type and environmental conditions. A discarded water bottle doesn’t vanish; it fragments into progressively smaller pieces, eventually becoming the microplastics (particles under 5mm) that now contaminate every ocean layer from surface waters to the deep seafloor.
This fragmentation pattern creates a critical challenge for microplastics tracking and cleanup mapping. Large plastic items concentrate in visible patches and shoreline accumulation zones, making them primary targets for volunteer cleanups. But as those same items break down, they disperse into the water column as microplastics, invisible to the naked eye yet bioavailable to filter-feeding organisms at the base of the food web. Mapping hotspots now requires identifying both macroplastic sources and the fragmentation zones where larger debris transforms into microscopic pollution.
2. Metal Objects: From Cans to Cables
Metal debris represents roughly 10-15% of marine pollution worldwide, spanning everything from discarded soda cans to abandoned cargo containers. Unlike plastics that fragment into smaller pieces, metals undergo corrosion, a gradual chemical breakdown that can take decades or even centuries depending on the alloy and environmental conditions.
Aluminum beverage cans dominate coastal cleanup tallies, corroding within 200-500 years in saltwater. Steel drums and shipping containers persist much longer, often 50+ years before significant structural breakdown occurs. Copper wire from marine cables and electrical equipment releases toxic compounds as it degrades, while galvanized steel items shed zinc coatings that accumulate in sediments.
The fishing industry contributes particularly problematic metal debris. Lead fishing weights and sinkers pose immediate toxicity threats, waterfowl and seabirds frequently ingest these small objects mistaking them for food or grit, leading to fatal lead poisoning. Many coastal regions now ban lead tackle specifically because of documented wildlife deaths. Stainless steel hooks, swivels, and wire leaders persist almost indefinitely, creating long-term entanglement hazards.
Metal density fundamentally shapes where this debris settles. Heavy items like engine parts, anchors, and steel cable sink quickly to the seafloor, concentrating in harbors, shipping lanes, and dumping zones. These benthic accumulations rarely appear in surface surveys but dominate underwater mapping efforts. Lighter metals like aluminum may float temporarily when trapped in packaging or attached to buoyant materials before eventually sinking.
Cleanup operations face unique challenges with metal debris. Corroded sharp edges create safety hazards for volunteers, while large industrial metals require specialized equipment for removal. Fortunately, metals retain recycling value even after ocean exposure, making them among the few debris types that generate recovery revenue to offset cleanup costs.
3. Glass Items: Slower to Break Down Than You Think
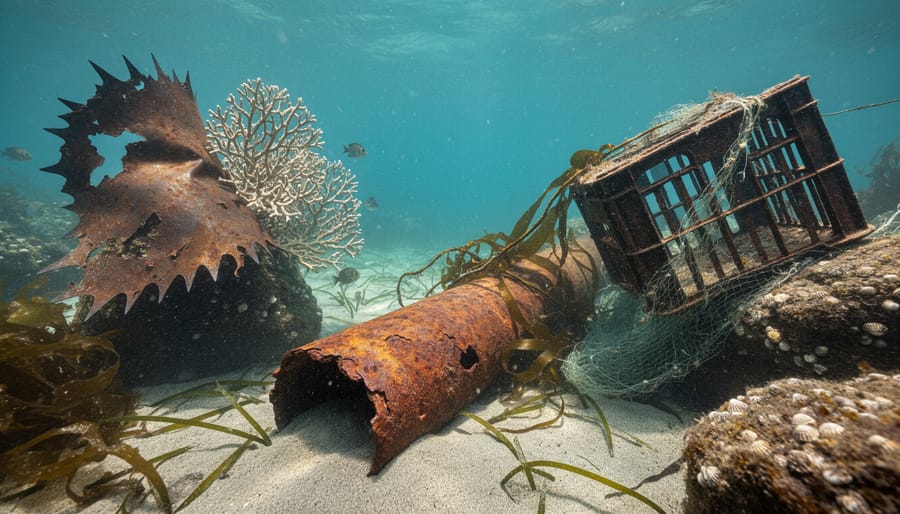
Glass ranks as the third most common inorganic material in marine debris surveys, accounting for roughly 5-7% of collected items during coastal cleanups. Beverage bottles dominate this category, followed by light bulbs, jars, and decorative glass objects that wash off decks or originate from coastal development.
Unlike plastic, glass doesn’t leach toxic chemicals. But the “harmless” label misses the bigger picture. Glass takes an estimated 1 million years to fully decompose in the ocean, far longer than most people expect. Instead of biodegrading, glass fragments through mechanical weathering. Wave action and sand abrasion gradually smooth sharp edges into the frosted, rounded pieces known as sea glass, a process that takes 20-40 years for small shards and centuries for bottles.
The physical hazards are immediate and lasting. Sharp glass cuts the flippers and mouths of sea turtles foraging in shallow waters. Broken bottle necks trap fish and crustaceans. On beaches, buried glass fragments injure barefoot beachgoers and nesting shorebirds. Beach-cleaning volunteers report glass as one of the most dangerous debris types to handle, requiring thick gloves and careful sorting.
During mapping operations, glass debris clusters predictably near urban coastlines, river mouths, and popular beach access points. Its density causes bottles and fragments to settle in the benthic zone rather than float in surface currents, making removal more labor-intensive than collecting floating plastics.
4. Rubber Products: Tires, Balloons, and Bands
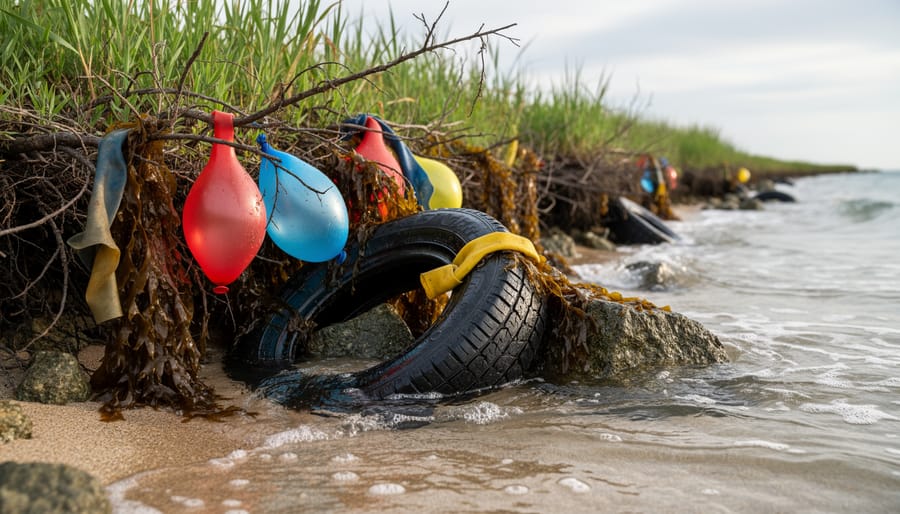
Rubber debris enters marine environments from land-based runoff, storm drains, recreational activities, and direct dumping. Vehicle tires rank among the heaviest contributors, whole tires dumped at sea, tire fragments from roadways washing into waterways, and microplastics abraded from tire wear during normal driving. A single tire can release over 4,000 particles per mile driven, many of which eventually reach the ocean through stormwater systems.
Latex balloons present a deceptive threat despite their “natural rubber” marketing. Though derived from rubber trees, modern balloons contain chemical additives and plasticizers that slow decomposition to 6-24 months in marine conditions, long enough to travel thousands of miles and be mistaken for jellyfish or squid by sea turtles and seabirds. Mylar balloons, technically plastic-coated, persist even longer. Beach cleanup data consistently ranks balloons in the top ten debris items recovered.
Rubber bands, latex gloves, fishing waders, shoe soles, and industrial rubber sheets add to the load. These items leach toxic compounds including zinc, sulfur, and heavy metals used in vulcanization. Marine animals frequently ingest smaller rubber pieces, causing intestinal blockages and starvation. Sea turtles show particular vulnerability, autopsies reveal rubber fragments in over 30% of stranded individuals in some coastal regions.
Cleanup crews face practical challenges with rubber debris: tires are too heavy for manual beach removal, requiring machinery; degraded rubber crumbles into fragments that blend with sand; and waterlogged rubber often sinks to the seafloor, escaping surface mapping efforts while continuing to leach chemicals into sediments.
5. Textile and Fabric Materials
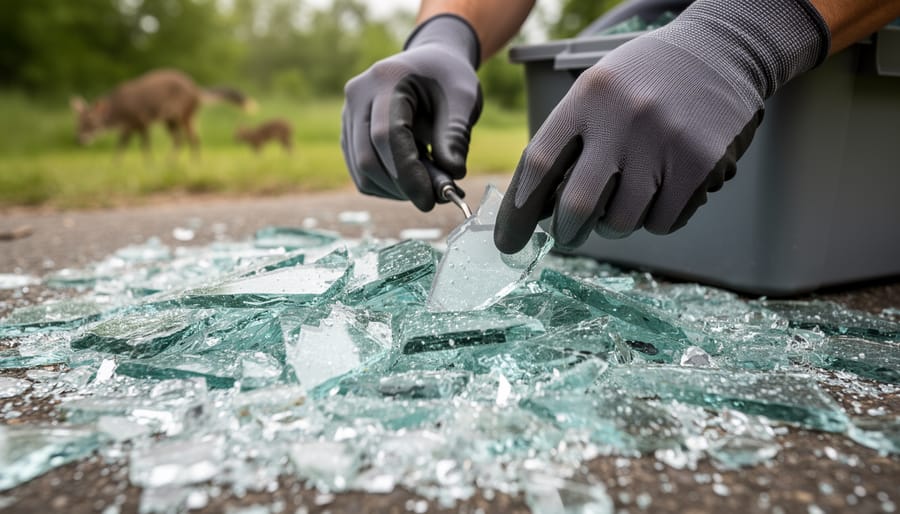
Textile and fabric materials represent a particularly insidious category of marine debris, accounting for roughly 5-10% of ocean waste by volume but causing disproportionate harm to marine ecosystems. This category spans a wide range of items: discarded clothing, synthetic rope, abandoned fishing nets (often called “ghost nets”), plastic tarps, and increasingly, microscopic fibers shed from everyday laundry.
The entanglement hazard from textile debris ranks among the most lethal threats to marine life. Ghost nets continue “fishing” for years after abandonment, trapping sea turtles, seals, dolphins, and sharks in dense synthetic webs they cannot escape. Rope fragments wrap around flippers and necks, causing deep lacerations or slow starvation as animals lose mobility. Even something as seemingly harmless as a discarded t-shirt can ensnare a young sea lion.
Synthetic fabrics, polyester, nylon, acrylic, and spandex, shed microfibers with every wash cycle, and these microscopic textile fragments now pervade marine food webs. Studies from 2025 found textile microfibers in 73% of deep-sea fish sampled in the North Atlantic. Unlike larger debris, these fibers infiltrate organisms at every trophic level, from filter-feeding zooplankton to apex predators.
Mapping textile debris presents unique challenges. Many fabric items become waterlogged and sink to the seafloor rather than floating at the surface where satellite imagery and aerial surveys can detect them. Nets draped over coral reefs or submerged clothing tangled in kelp forests often go unrecorded in standard debris surveys, meaning official estimates likely undercount the true textile pollution load. Cleanup operations increasingly use underwater drones and diver-assisted removal to address this hidden component of marine debris.
6. Paper and Cardboard Waste
Paper and cardboard materials account for roughly 2-5% of documented marine debris, a smaller fraction than plastics or metals but still present enough to warrant concern during coastal cleanup operations. The most common items include cigarette packaging, beverage cartons, cardboard boxes, food wrappers, and paper bags that reach waterways through littering and stormwater runoff.
You might assume paper debris breaks down quickly in saltwater. It doesn’t always. Untreated paper does disintegrate within weeks to months when submerged, but many modern paper products contain chemical additives that significantly extend their persistence. Cigarette packaging, for instance, uses polymer-coated paperboard that resists water absorption. Waxed milk cartons, juice boxes, and coated food containers can float for months before fragmenting, during which time marine animals may ingest them or become entangled.
Chemical treatments create additional problems beyond persistence. Bleaches, dyes, adhesives, and waterproofing agents leach into seawater as paper debris degrades, introducing contaminants that affect water chemistry and marine organisms. Volunteers conducting debris surveys often find paper items in surprisingly intact condition years after disposal, particularly in low-oxygen sediments where decomposition slows dramatically.
The relatively low percentage of paper debris in marine surveys reflects both its eventual biodegradation and the reality that heavier, waterlogged paper sinks to the seafloor where standard beach cleanup operations cannot reach it. Mapping efforts that include underwater surveys consistently report higher paper concentrations than surface-only counts suggest.
7. Processed Wood and Organic Materials
Processed wood stands apart from natural driftwood because of chemical treatments that prevent normal decomposition. Lumber, plywood, construction materials, and treated timber wash into oceans from coastal building sites, storm debris, and illegal dumping. Unlike untreated logs that eventually break down and support marine ecosystems, manufactured wood products contain preservatives, paints, varnishes, and adhesives that leach toxins for years.
Pressure-treated lumber contains chromated copper arsenate or newer copper-based preservatives that release heavy metals into seawater. Marine organisms absorb these compounds, introducing them into food chains. Painted wood debris adds lead and volatile organic compounds to contaminated zones. Plywood separates into layers that trap marine animals, while the formaldehyde-based glues resist breakdown and pollute surrounding water.
Manufactured wood accounts for roughly 3-5% of marine debris in coastal surveys, but its impact exceeds that percentage due to chemical contamination. Processors often misidentify treated wood as natural organic material during community mapping efforts, underestimating its environmental threat. The materials sink or float unpredictably depending on saturation levels, complicating removal strategies.
Volunteer cleanup teams require gloves and proper disposal protocols when handling treated wood debris. Processing facilities must separate it from recyclable natural materials to prevent contamination. Recognition of processed wood as distinct from harmless driftwood improves both mapping accuracy and cleanup effectiveness.
Understanding Debris Composition Terms
Marine debris science uses specific terminology to describe and classify ocean pollution materials. Understanding these terms helps volunteers, researchers, and cleanup crews communicate effectively about what they find and how to address it.
- Microplastics vs. Macroplastics
- Microplastics are plastic particles smaller than 5mm, while macroplastics are larger visible items like bottles and bags. Both categories require different detection methods and cleanup approaches.
- Persistent vs. Biodegradable Debris
- Persistent debris (plastics, metals, glass) resists natural decomposition for decades or centuries, whereas biodegradable materials break down through biological processes within months to years. Most marine debris falls into the persistent category.
- Pelagic vs. Benthic Debris
- Pelagic debris floats on or near the ocean surface, transported by currents and winds. Benthic debris sinks to the seafloor, often accumulating in underwater canyons or seagrass habitat where it’s harder to map and remove.
- Source Attribution
- The process of tracing debris back to its origin, whether land-based (80% of marine debris) or ocean-based sources like fishing vessels and cargo ships. Branding, manufacturing codes, and material types provide attribution clues.
- Debris Load Density
- A measurement of debris concentration in a specific area, typically expressed as items per square kilometer or kilograms per coastline mile. Higher density areas become priority targets for cleanup operations.
These technical distinctions aren’t just academic. Mapping teams use this vocabulary to standardize data collection across different locations and organizations, creating datasets that reveal patterns and drive policy changes. When you participate in a cleanup, you’re contributing to this shared knowledge base.
Why Debris Composition Matters for Mapping and Cleanup
Knowing what marine debris is made of transforms cleanup from random trash collection into strategic environmental restoration. When volunteers and professionals understand they’re dealing with persistent plastics versus biodegradable paper or heavy metals versus buoyant foam, they can deploy the right tools, target the right locations, and maximize every hour spent protecting our oceans.
Different materials demand different removal approaches. Plastic bottles and containers require simple hand collection and sorting, but microplastic extraction needs specialized mesh nets and filtration systems. Metal debris often sinks to the seafloor, requiring diving equipment or trawling methods that surface materials can’t justify. Rubber tires are too heavy for standard beach cleanups and need machinery, while lightweight foam fragments scatter across vast areas, calling for broad-sweep collection strategies. Textile debris like fishing nets demands cutting tools to safely remove entangled materials without further damaging reefs or marine life.
Mapping initiatives categorize debris by material because composition patterns reveal pollution sources and pathways. High concentrations of fishing gear point to commercial fishing routes requiring industry engagement, while clusters of single-use plastics near rivers indicate land-based sources needing waste management improvements. This categorized data helps municipalities decide whether to ban foam takeout containers, require fishing gear buyback programs, or install storm drain filters, targeted prevention beats generic cleanup every time.
Volunteer debris surveys contribute directly to this global dataset. Citizen scientists using standardized protocols record not just how much debris they collect, but what it’s made of, creating the composition maps that drive smarter policy and more effective future cleanups.
How We Chose This List
Our selection process prioritized scientific rigor over subjective judgment. We drew primarily from NOAA’s Marine Debris Program datasets, Ocean Conservancy’s International Coastal Cleanup annual reports spanning 2020-2026, and peer-reviewed marine pollution research published in journals like Marine Pollution Bulletin and Environmental Science & Technology.
The seven categories emerged through three filters. First, prevalence: each material type must represent at least 2% of debris collected across multiple ocean basins to merit inclusion. Second, environmental persistence: we focused on materials that remain in marine systems long enough to impact ecosystems, excluding truly biodegradable items like unprocessed natural materials. Third, operational relevance: cleanup teams and mapping initiatives consistently distinguish these categories in their protocols, making them practical reference points rather than purely academic classifications.
We excluded highly specific subcategories (like “beverage bottle caps” as separate from plastics) to maintain clarity, instead addressing variants within broader material groups. Geographic data came from Pacific, Atlantic, and Mediterranean cleanup operations to ensure global applicability rather than region-specific biases.
Key Details to Know
- Material composition directly determines cleanup strategy, nets require cutting tools, while microplastics need fine-mesh collection systems that larger debris doesn’t.
- Most debris starts as land-based waste (80%), meaning prevention efforts at storm drains, rivers, and coastal zones address the problem more effectively than ocean-only cleanup.
- Composition varies dramatically by location: tourist beaches accumulate bottles and food packaging, fishing zones contain gear and buoys, while open ocean gyres concentrate buoyant plastics and foam.
- Density matters for mapping, heavy metals and glass sink to the seafloor where surveys miss them, creating an incomplete picture of total debris load.
- Chemical additives in plastics (flame retardants, plasticizers) and treated wood release toxins as materials degrade, compounding the physical threat with chemical pollution.
- Volunteer data collection through apps like Marine Debris Tracker helps scientists identify composition patterns and predict where new accumulations will form.
These practical insights transform composition knowledge into actionable cleanup intelligence. When you join a beach cleanup or debris survey, categorizing items by material type isn’t busywork, it’s creating the data scientists need to target prevention upstream and deploy cleanup resources where they’ll make the biggest difference.
Common Questions About Marine Debris Composition
What percentage of marine debris is plastic?
Plastics typically make up 60 to 80 percent of all marine debris collected during cleanup operations, though this proportion varies by location and proximity to urban areas. The remaining fraction includes metals, glass, rubber, textiles, paper, and processed organic materials.
Does marine debris eventually decompose in the ocean?
Most marine debris persists for decades or centuries rather than decomposing. Plastics fragment into smaller pieces but never fully biodegrade, while metals corrode slowly, glass can take thousands of years to break down, and chemically treated materials resist natural decomposition processes.
How does debris composition vary by location?
Coastal areas near cities show higher concentrations of consumer packaging and single-use items, while remote islands and mid-ocean zones collect more fishing-related debris and buoyant plastics carried by currents. Rivers deposit different material profiles than direct ocean sources.
Can we track where specific debris comes from?
Scientists use markings, manufacturing codes, language on labels, and material characteristics to trace debris origins. Ocean current models combined with composition data help identify likely source regions, though pinpointing exact origins remains challenging for most items.
How has marine debris composition changed over time?
Plastic’s dominance has grown dramatically since the 1970s, while glass and metal proportions have declined relative to total debris volume. Single-use plastics and microplastics have become more prevalent, reflecting shifts in consumer packaging and manufacturing practices over the past five decades.
These questions reflect the most frequent concerns raised by cleanup volunteers, educators, and researchers working with marine debris data. Understanding composition patterns helps teams prepare appropriate collection tools and storage methods. Different materials present different handling challenges during beach cleanups and offshore recovery operations.
The answers also reveal why composition tracking matters beyond scientific curiosity. When we know that fishing gear dominates debris in one region while beverage containers lead in another, cleanup organizations can tailor their outreach and prevention campaigns to address the actual sources. Composition data directly informs which industries, products, and behaviors require the most urgent intervention in specific geographic areas.
Marine debris’s composition tells us exactly what we’re up against, and gives us a clear roadmap for tackling it. While plastics dominate at 60-80% of ocean pollution, the remaining materials, metals, glass, rubber, textiles, paper, and processed organics, each demand their own removal strategies and prevention approaches. This diversity isn’t discouraging; it’s empowering. When cleanup teams understand what they’re collecting, they map debris more accurately, remove it more efficiently, and trace it back to sources that can be addressed through policy and education.
The progress we’ve made in marine debris science over the past decade proves that knowledge drives action. Standardized composition surveys now inform targeted interventions, from fishing gear buyback programs to microfiber filtration requirements. Every data point collected during a beach cleanup contributes to this growing understanding, helping researchers identify emerging threats before they become widespread problems.
You can be part of this solution. The Marine Biodiversity Science Center offers volunteer opportunities in debris mapping and cleanup operations throughout the year, connecting your efforts directly to ongoing research. Whether you join a single weekend cleanup or commit to long-term monitoring, your participation generates data that shapes conservation strategies and protects marine ecosystems. Visit our volunteer programs page to find upcoming events in your area, and help us turn composition knowledge into ocean health. Together, we’re building a future where marine debris becomes a solved problem, not an accepted reality.

jessica
Ava Singh is an environmental writer and marine sustainability advocate with a deep commitment to protecting the world's oceans and coastal communities. With a background in environmental policy and a passion for storytelling, Ava brings complex topics to life through clear, engaging content that educates and empowers readers. At the Marine Biodiversity & Sustainability Learning Center, Ava focuses on sharing impactful stories about community engagement, policy innovations, and conservation strategies. Her writing bridges the gap between science and the public, encouraging people to take part in preserving marine biodiversity. When she’s not writing, Ava collaborates with local initiatives to promote eco-conscious living and sustainable development, ensuring her work makes a difference both on the page and in the real world.