Marine Biodiversity Science Center

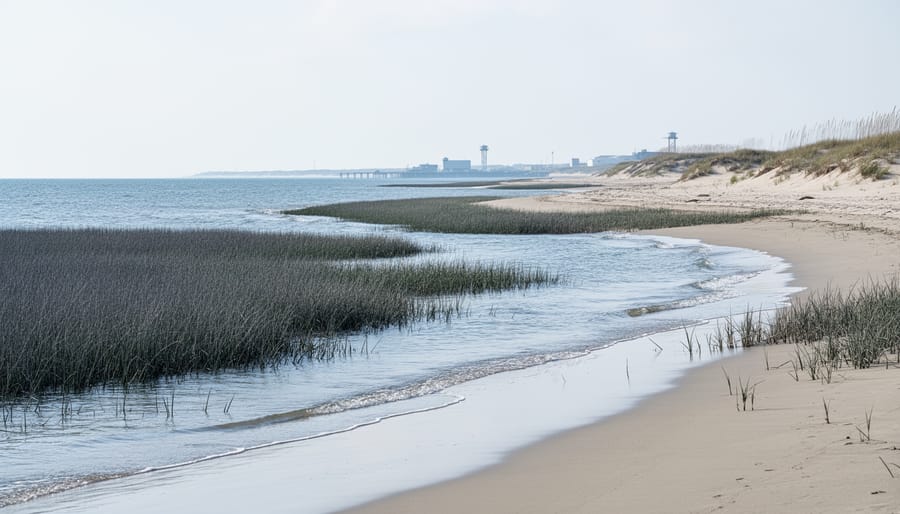
Virginia’s coastline is changing, and the data is undeniable: sea levels are rising faster here than almost anywhere else on the Atlantic coast. If you’re searching for a Virginia sea level rise map, you need tools that show not just current flooding risks but also future projections for 2050, 2080, and beyond. These maps, available through state agencies like the Virginia Institute of Marine Science (VIMS) and NOAA’s Sea Level Rise Viewer, combine tidal gauge data, satellite measurements, and climate models to reveal which properties, ecosystems, and communities face the greatest threat from coastal inundation.
Understanding these maps goes far beyond protecting individual property values. Virginia’s extensive wetlands, barrier islands, and estuaries support extraordinary marine biodiversity, from diamondback terrapins nesting on disappearing beaches to vital seagrass beds that serve as nurseries for commercially important fish species. As water levels climb an average of 5 millimeters per year in Hampton Roads (nearly twice the global rate due to land subsidence), the ecological infrastructure that sustains both wildlife and the blue economy faces unprecedented pressure.
The challenge is learning to read these maps effectively. Color-coded flood scenarios, vertical datum references, and probabilistic modeling can seem overwhelming at first glance. But once you understand what the data reveals about storm surge vulnerability, permanent inundation timelines, and adaptation windows, these tools become essential for everyone from coastal homeowners to conservation planners working to preserve critical habitats.
This guide will walk you through accessing Virginia’s most reliable sea level rise mapping resources, interpreting the projections they offer, and applying that knowledge to real-world decisions about property, infrastructure, and marine ecosystem protection. The science is clear, the stakes are high, and the time to act is now.
What Virginia Sea Level Rise Maps Show
Modeling Future Scenarios
Virginia’s sea level rise maps present multiple scenarios, typically ranging from 1 foot to 6 feet or more of rise, to account for uncertainty in future greenhouse gas emissions, ice sheet dynamics, and regional oceanic patterns. These aren’t single predictions but rather a range of plausible futures designed to help planners prepare for different levels of risk.
The timeframes vary by tool, but most projections extend to 2050, 2080, and 2100, with some platforms offering custom date ranges. A 1-foot scenario might represent conditions we could see by mid-century under moderate emissions, while a 3-foot rise often maps to late-century projections if current trends continue. The 6-foot scenarios capture worst-case possibilities involving accelerated Antarctic ice melt, less likely but catastrophic if realized.
Several factors drive the variation in these predictions. Global temperature trajectories depend on emissions pathways we haven’t yet locked in, creating a fundamental uncertainty that widens with time. Local subsidence along Virginia’s coast, where land is slowly sinking due to glacial rebound and groundwater extraction, adds 1 to 2 millimeters per year on top of global Mean Sea Level (MSL) rise, making the Chesapeake Bay region one of the fastest-sinking coastlines in North America. Ocean circulation changes, particularly slowdowns in the Gulf Stream, can redistribute water masses and amplify regional impacts beyond the global average. Ice sheet behavior in Greenland and Antarctica remains the largest wildcard, minor variations in melt rates translate to feet of difference by century’s end, which is why maps offer multiple scenarios rather than a single forecast.
Impact on Maritime Zones and Coastal Boundaries
Rising seas don’t just flood land, they redraw legal and ecological boundaries that govern everything from shipping lanes to conservation zones along Virginia’s coast. As water levels climb, the baseline from which maritime zones are measured shifts inland, potentially altering the outer limits of territorial waters, Exclusive Economic Zones, and state versus federal jurisdictional lines. For Virginia’s extensive system of marine protected areas, this creates a moving target: boundaries defined by shoreline features or fixed coordinates may no longer align with the actual land-water interface, complicating enforcement and habitat protection efforts.
Navigation channels face dual pressures. Deeper water in some areas might seem beneficial, but accelerated shoaling in others, driven by sediment redistribution as marshes drown and barrier islands migrate, requires constant dredging adjustments. Channel markers and nautical charts need frequent updates as familiar landmarks disappear beneath the waves.
Chesapeake Bay’s complex network of tributaries and tidal creeks presents particular challenges. Traditional boundaries separating state-managed waters from federal jurisdiction blur when coastlines retreat hundreds of feet inland. Oyster sanctuaries, crab fishery zones, and submerged aquatic vegetation beds all shift with the waterline, demanding adaptive management frameworks that current static boundary systems weren’t designed to handle. Property disputes intensify too, as Virginia applies the common law doctrine of erosion and accretion, meaning landowners can lose acreage to rising tides while gaining none from new deposition patterns typical of gradual sea level change.
Who Can Access and Use These Maps
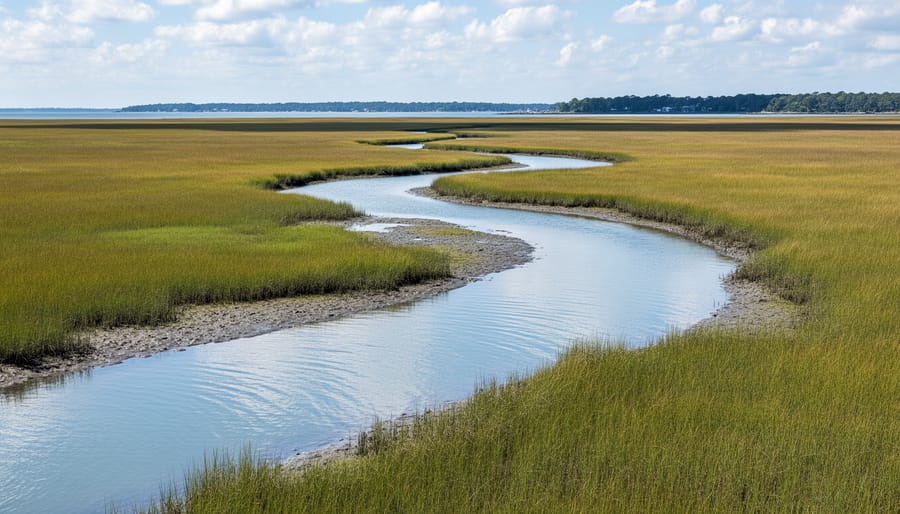
Virginia’s sea level rise maps are designed for broad public access, with most tools available to anyone with an internet connection. The state and federal agencies that maintain these resources intentionally keep barriers low, recognizing that informed coastal planning requires widespread engagement from diverse stakeholders.
Property owners along the Chesapeake Bay and Atlantic coastline can access these maps without registration or fees to assess flood risk, guide construction decisions, and understand insurance implications. Municipal and regional planners use the same publicly available platforms to inform zoning updates, infrastructure investments, and evacuation route planning. Researchers and students typically find open access sufficient for academic work, though some may request raw datasets or higher-resolution imagery that requires institutional credentials.
The primary user groups and their typical applications include:
- Coastal property owners: evaluating flood vulnerability, guiding elevation decisions, and understanding long-term property value implications
- Municipal planners and local governments: updating comprehensive plans, prioritizing infrastructure improvements, and establishing setback requirements
- Maritime industry stakeholders: assessing impacts on port facilities, navigation channels, and waterfront commercial operations
- Conservation organizations: identifying threatened habitats, prioritizing land acquisition, and designing restoration projects
- Emergency management officials: developing evacuation plans, positioning resources, and coordinating disaster response
- Real estate professionals and developers: conducting due diligence, informing site selection, and meeting disclosure requirements
- Educators and the general public: learning about coastal changes, participating in citizen science, and engaging in community resilience planning
Representatives from marine industries including aquaculture operations, commercial fisheries, and maritime transport regularly consult these maps to anticipate operational challenges and adapt business models to changing conditions. Advanced analytical tools or bulk data downloads may require you to contact the Virginia Institute of Marine Science or the Department of Conservation and Recreation directly, but these requests are typically accommodated for legitimate planning or research purposes at no cost.
How to Access and Use Virginia Sea Level Rise Mapping Tools
Primary Mapping Platforms and Databases
Virginia offers several robust mapping platforms that provide free, publicly accessible sea level rise data tailored to different user needs and technical skill levels.
The Virginia Coastal Resilience Master Plan Mapper serves as the state’s official planning tool, developed by the Virginia Institute of Marine Science in partnership with state agencies. Access it through the Department of Conservation and Recreation’s coastal resilience webpage. This platform integrates multiple data layers including future flood scenarios, critical infrastructure locations, natural resource inventories, and socioeconomic vulnerability indicators. Users can toggle between sea level rise increments from one to six feet and overlay current FEMA flood zones, making it particularly valuable for municipal planners and property assessors.
NOAA’s Sea Level Rise Viewer () provides nationwide coverage with detailed inundation mapping for Virginia’s Chesapeake Bay and Atlantic coastlines. This tool allows users to visualize water surface elevation at specific increments, view confidence intervals, and assess flooding frequency scenarios. It includes photo simulations and depth measurements, helping non-technical audiences grasp the visual impact of projected changes.
VIMS CoastGIS offers the most comprehensive scientific dataset, featuring high-resolution shoreline change analyses dating back decades. Researchers and conservation organizations can download raw spatial data files through the VIMS Center for Coastal Resources Management portal. This platform requires basic GIS knowledge but provides unmatched detail for habitat-level analysis and peer-reviewed research applications.
Each platform updates regularly as new elevation data and climate projections become available, typically on annual or biennial cycles.
Interpreting Map Data for Marine Conservation
Reading Virginia’s sea level rise maps through a conservation lens requires focusing on specific data layers that reveal threats to marine ecosystems. Start by examining the elevation gradient, areas shown in darker blues or purples typically indicate land less than three feet above mean high water, making them prime candidates for permanent inundation or salt marsh migration corridors.
Pay close attention to current wetland boundaries overlaid with projected inundation zones. Where these overlap, you’re identifying salt marshes, tidal creeks, and estuarine habitats that may either expand inland or drown in place depending on coastal squeeze from development. The “Medium” scenario (1.5 feet by 2050) often shows critical tipping points for Virginia’s coastal wetlands.
Toggle between scenario layers to spot habitats facing imminent risk versus longer-term threats. Oyster reef locations shown in proximity to projected erosion zones signal potential loss of water filtration capacity and fish nursery grounds. Similarly, examine barrier island systems, progressive inundation patterns reveal whether these critical storm buffers can migrate landward or will fragment, exposing mainland marshes to wave action.
Use the measurement tools to calculate potential habitat loss in specific conservation areas. If a protected seagrass bed sits within the two-foot inundation zone, that data becomes essential for prioritizing restoration sites on higher ground or advocating for sediment management strategies that maintain suitable depths.
Exporting and Sharing Data
Most Virginia sea level rise mapping platforms let you download data directly for offline analysis or inclusion in formal documents. The NOAA Sea Level Rise Viewer provides a “Download Data” button that delivers GIS-compatible shapefiles showing inundation boundaries for your selected scenario. Virginia’s Coastal Resilience Master Plan viewer offers similar export functions, typically accessible through a toolbar icon that generates ZIP files containing elevation layers, flood extent polygons, and metadata files explaining projection parameters.
When incorporating these maps into grant applications or conservation plans, always include the data source, scenario selected (for example, 3-foot rise by 2080), and the date you accessed the tool, since agencies update models periodically. Many platforms generate automated reports with citations you can copy directly. For presentations to community groups or municipal boards, most viewers include a “Print Map” or “Create PDF” feature that captures your current view with legends and scale bars intact, making it straightforward to share visual evidence of projected impacts on specific parcels or habitats.
Rights, Obligations, and How to Apply the Data
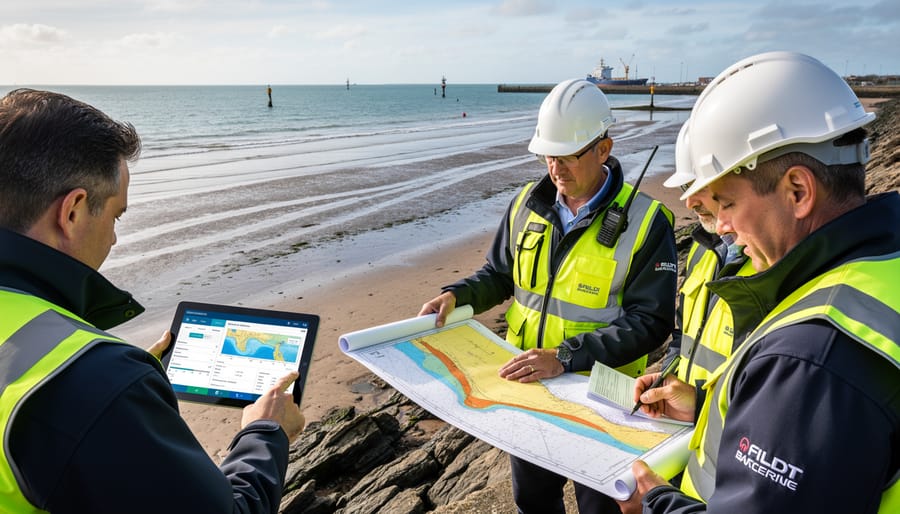
Virginia’s sea level rise maps are publicly available and openly accessible, meaning you can use them for planning, research, advocacy, or personal decision-making without special permission. Most platforms, including NOAA’s Sea Level Rise Viewer and Virginia’s Coastal Resilience Master Plan tools, operate under government data policies that encourage broad public use. When incorporating these maps into reports, presentations, or publications, cite the specific source and include the date you accessed the data. Proper attribution ensures transparency and allows others to verify your findings.
If you’re submitting permit applications for coastal development, stormwater management, or shoreline stabilization projects, you can reference sea level rise maps to demonstrate compliance with resilience standards or to justify adaptive design choices. Many Virginia localities now require applicants to address future flooding scenarios in their plans, and these maps provide the evidentiary basis for those discussions. Similarly, conservation easements and habitat restoration proposals gain credibility when you show how projected inundation will affect target species or ecosystems. Attach screenshots or exported shapefiles as appendices, and clearly state which scenario and timeframe you’ve applied.
Local governments can incorporate sea level rise data into comprehensive plans, zoning ordinances, and floodplain regulations. Virginia Code encourages localities to consider climate adaptation in their land use decisions, and these maps offer the science and law foundation for updating building codes, setback requirements, or conservation overlay districts. When drafting ordinances, specify the scenario and data source you’re using to establish defensible standards. This approach ties resilience policy to credible projections rather than arbitrary rules.
For marine conservation projects, sea level rise maps help prioritize areas for wetland migration corridors, living shoreline installations, or oyster reef construction. Grant funders increasingly expect applicants to show how their projects account for future conditions. Demonstrating that you’ve analyzed inundation zones and identified climate-smart restoration sites strengthens your proposal and aligns your work with broader ocean policy enforcement efforts. Always pair the maps with on-the-ground assessments, because models can’t capture every local variable, sediment supply, subsidence rates, or human infrastructure, that will shape real outcomes.
Implications for Marine Biodiversity and Coastal Ecosystems
Virginia’s projected sea level rise poses cascading threats to the coastal ecosystems that support the state’s remarkable marine biodiversity. Salt marshes, which currently protect over 200,000 acres along the Chesapeake Bay and Atlantic coast, face a double squeeze: rising water from seaward and human development blocking landward migration. As these wetlands drown or fragment, they take with them critical nursery habitat for blue crabs, spot, croaker, and juvenile striped bass. Models show that a two-foot rise could eliminate 30-50% of existing marsh area in some regions if adjacent uplands remain developed, fundamentally reshaping the food web that supports Virginia’s $600 million seafood industry.
Seagrass beds, already stressed by poor water quality and boat traffic, will confront additional pressure as changing salinity gradients push species like eelgrass northward while subtropical varieties move in. The transition zones where these shifts occur often experience temporary declines in coverage, leaving scallops, seahorses, and juvenile fish without the shelter and foraging grounds they require during vulnerable life stages.
Barrier islands along Virginia’s Eastern Shore, home to piping plover nesting sites and critical stopover habitat for red knots and other shorebirds migrating along the Atlantic Flyway, will narrow, overwash more frequently, and potentially breach or migrate landward. This dynamic reshaping can destroy nesting beaches faster than new habitat forms, compressing the window when threatened species can successfully reproduce. Diamondback terrapins, which depend on salt marsh edges and sandy nesting areas just above the high tide line, lose viable nesting habitat as beaches erode and marshes convert to open water.
Oyster reefs face depth challenges as waters deepen; reefs that currently thrive in optimal light and salinity zones may find themselves submerged too deeply for adequate feeding, or exposed to different predator communities as their vertical position in the water column shifts. Horseshoe crabs, which spawn on specific beach slopes at precise tidal elevations, will need to find new spawning grounds as traditional beaches submerge or armor, disrupting the timing and location of spawning aggregations that migratory shorebirds depend on for refueling.
Maritime zone boundaries will shift seaward as the baseline moves, potentially redrawing marine protected area borders and wildlife management zones in ways that no longer align with the habitats they were designed to protect. Conservation easements and sanctuary boundaries tied to fixed coordinates may suddenly cover open water rather than functioning wetlands, requiring legal and administrative adjustments to maintain protection for mobile ecosystems.
Where to Get Help and Additional Resources
Navigating Virginia’s sea level rise data becomes significantly easier when you know where to turn for expert guidance. A network of state agencies, research institutions, and conservation organizations stands ready to help interpret projections, apply data to planning decisions, and connect stakeholders with technical resources.
The Virginia Department of Conservation and Recreation serves as the primary coordinator for coastal resilience planning statewide. Their Division of Natural Heritage maintains current sea level rise projections and offers technical assistance for local governments developing adaptation strategies. Reach them at (804) 786-7951 or through their coastal resilience portal at . For questions about specific mapping tools or data interpretation, the Virginia Coastal Zone Management Program provides direct consultation services and hosts quarterly workshops on using sea level rise data in permitting and land use decisions.
| Organization | Primary Services | Contact Information |
|---|---|---|
| Virginia Institute of Marine Science (VIMS) | Scientific data, technical modeling, research support, and training workshops | (804) 684-7000 |
| NOAA Office for Coastal Management | Federal mapping tools, Digital Coast resources, and coastal change analysis | |
| The Nature Conservancy Virginia | Nature-based solutions consulting, habitat restoration planning, and community outreach | (434) 295-6106 |
| Wetlands Watch | Advocacy support, citizen science programs, coastal monitoring volunteer opportunities | (757) 531-0450 |
Local planning departments in coastal jurisdictions including Norfolk, Virginia Beach, Hampton, and the Eastern Shore counties employ resilience coordinators who can help residents and businesses interpret how sea level rise projections apply to specific properties or projects. Many offer one-on-one consultations at no cost.
For hands-on involvement, several citizen science initiatives welcome volunteers to monitor coastal change. The Virginia Coast Reserve Long-Term Ecological Research program, managed by VIMS, recruits participants for marsh elevation monitoring and shoreline surveys. Wetlands Watch coordinates monthly “Catch the King” tide observations, where community members document high-tide flooding events that preview future chronic inundation. These programs provide training and equipment while contributing valuable ground-truth data that refines sea level rise models.
Academic support is available through Virginia Sea Grant, housed at VIMS, which funds research projects and extension programs connecting scientific findings to practical coastal management. Their Marine Advisory Program offers free webinars on topics from living shorelines to floodplain mapping.
Common Questions About Virginia Sea Level Rise Maps
How accurate are Virginia’s sea level rise projections?
The maps reflect the best available science from NOAA, VIMS, and climate modeling consortia, but they’re predictions, not guarantees. Accuracy depends on which greenhouse gas emissions pathway humanity follows, local land subsidence rates, and how quickly ice sheets melt, factors that carry inherent uncertainty. For planning purposes, most agencies recommend using multiple scenarios (conservative, moderate, and high projections) rather than relying on a single forecast, and treating the maps as risk assessment tools rather than precise blueprints of the future coastline.
How often are the maps updated?
Major updates typically occur every three to five years as new tide gauge data, satellite measurements, and climate models become available. NOAA revises its Sea Level Rise Viewer when the Interagency Sea Level Rise Task Force releases updated federal projections, while VIMS refreshes CoastGIS data as Virginia’s LiDAR elevation surveys are re-flown. Between major updates, some platforms adjust for observed subsidence trends or correct elevation data errors. If you’re working on a long-term project, check the publication date on any map layer and subscribe to agency newsletters for update announcements.
Can I use these maps to make property purchase decisions?
Yes, but consult them alongside flood insurance rate maps, local zoning regulations, and a professional property assessment. The sea level rise maps show long-term inundation risk that standard flood maps may not fully capture, especially for timeframes beyond 30 years.
What’s the difference between the NOAA viewer and Virginia’s state tools?
NOAA’s viewer covers the entire U.S. coast with standardized methodology, while Virginia’s Coastal Resilience Master Plan tools incorporate state-specific data like Chesapeake Bay dynamics, localized subsidence rates, and infrastructure layers. For Virginia-focused work, the state tools often provide finer resolution and more relevant planning context.
How can I get involved in coastal resilience planning?
Attend public meetings held by your locality’s planning department or Coastal Zone Management program, join citizen science monitoring projects coordinated through VIMS or the Virginia Coastal Policy Center, or volunteer with groups like the Chesapeake Bay Foundation on marsh restoration efforts that build natural flood buffers.
Who should I contact if I find an error in the map data?
Report data issues directly to the platform provider. For the Virginia Coastal Resilience tools, contact the Department of Conservation and Recreation’s Coastal Resilience team. For NOAA’s viewer, use the feedback link on their site. VIMS accepts corrections through their Center for Coastal Resources Management. Include specific coordinates, a description of the discrepancy, and any supporting documentation like recent survey data. Agencies take accuracy seriously and investigate reported errors, though resolution can take months depending on whether the fix requires new field measurements or just database corrections.
Virginia’s sea level rise maps aren’t just planning tools, they’re windows into the future of our coastal ecosystems. The data they reveal demands action now, while we still have time to protect critical habitats and the species that depend on them. Salt marshes that buffer our shores, seagrass beds that nursery juvenile fish, oyster reefs that filter our waters, all face transformation or loss as seas climb. Every foot of rise reshapes maritime boundaries and threatens biodiversity hotspots that have taken millennia to develop.
The science is clear, and the tools are at your fingertips. Explore Virginia’s mapping platforms to understand what’s coming to your region. Attend local coastal resilience meetings where these projections inform zoning decisions and infrastructure investments. Your voice matters in shaping how communities respond.
But understanding alone isn’t enough. Coastal ecosystems need advocates who show up. Join volunteer monitoring programs that track shoreline changes, document species shifts, and contribute citizen science data that refines our models. Participate in marsh restoration projects that create living buffers against storm surge. Support conservation easements that preserve migration corridors for wildlife adapting to new conditions.
The maps show us what could happen. Our collective response determines what actually does. Whether you’re a coastal resident, marine professional, educator, or simply someone who cares about Virginia’s extraordinary coastal heritage, you have a role in this urgent work. The time to engage is now, before projections become irreversible realities.

jessica
Ava Singh is an environmental writer and marine sustainability advocate with a deep commitment to protecting the world's oceans and coastal communities. With a background in environmental policy and a passion for storytelling, Ava brings complex topics to life through clear, engaging content that educates and empowers readers. At the Marine Biodiversity & Sustainability Learning Center, Ava focuses on sharing impactful stories about community engagement, policy innovations, and conservation strategies. Her writing bridges the gap between science and the public, encouraging people to take part in preserving marine biodiversity. When she’s not writing, Ava collaborates with local initiatives to promote eco-conscious living and sustainable development, ensuring her work makes a difference both on the page and in the real world.